Sleip renews sponsorship for EGAS Live Course in 2026
Sleip will continue its sponsorship of the EGAS Live Course 2026 — marking our 4 year supporting advanced post-graduate education in quantitative gait analysis for equine veterinarians.

Christoffer Roepstorff explains what Sleip measures and how to evaluate the reliability of gait analysis results.
At Sleip, our focus is to provide reliable and understandable data for equine gait analysis. Reflecting this commitment, Sleip has moved from standard deviation to confidence intervals (CI) to give users a clearer picture of data reliability.
We asked Sleip’s Biomechanical Researcher, Christoffer Roepstorff, to talk us through what Sleip measures and how the switch to confidence intervals will help users gauge the reliability of their analysis results.
Christoffer Roepstorff,
Biomechanical Researcher

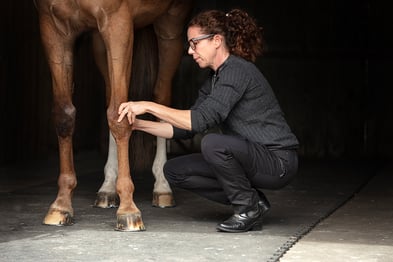
Essentially, I’m a bridge between our veterinary medical and tech teams. I’m responsible for converting computer signals into locomotion data – mainly related to lameness. I work on signal processing of the horse's movement, which Sleip extracts from the recorded trot-ups. I analyse these signals to extract variables that can be used to assess lameness objectively. For instance, through the vertical movement of the horse’s head and pelvis, we can derive the impact and push-off variables. These variables help in diagnosing lameness accurately.
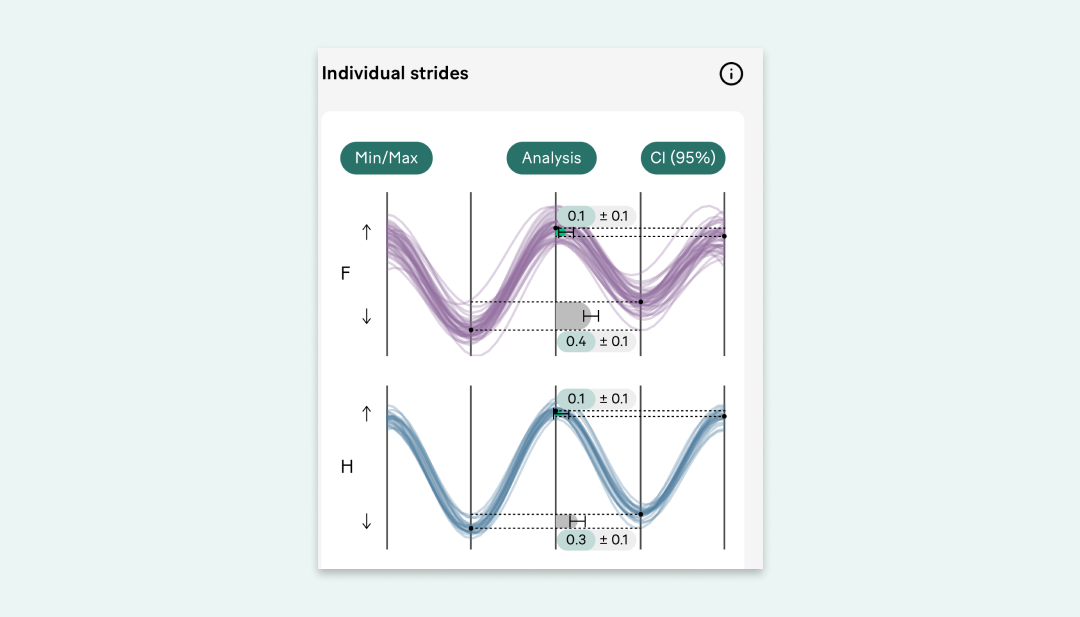
Before we dig into what the numbers mean, we need to briefly talk about the individual strides and why they are important. An individual stride curve represents the vertical movement of the head, or the pelvis, for one single stride. The following analogy illustrates why this is interesting from a lameness perspective.
Imagine that you put a stone in one shoe and then start running. Every time the shoe with the stone in it hits the ground, you will likely feel a bit of pain, and as a result, you will start to limp. That limp is nothing more than a symptom of you not wanting to carry weight on the foot where you experience the pain. The limp will manifest as an asymmetry in your vertical movement. You will move more, both when landing and pushing off from the ground, with the foot that is not painful compared to the foot where the stone is hurting you.
This analogy also illustrates why we sometimes talk about movement asymmetry related to weight-bearing lameness. Because horses have four legs and a horizontally oriented spine, they can actually limp with both head and pelvis.
The Sleip app gives you a quantification of the movement asymmetry. This is where the terms impact and push-off come in. The push-off variable quantifies the difference in maximum height you reach when pushing off with the left limb compared to the right. The impact variable quantifies the difference in the minimum height you reach when landing on the left limb compared to the right.
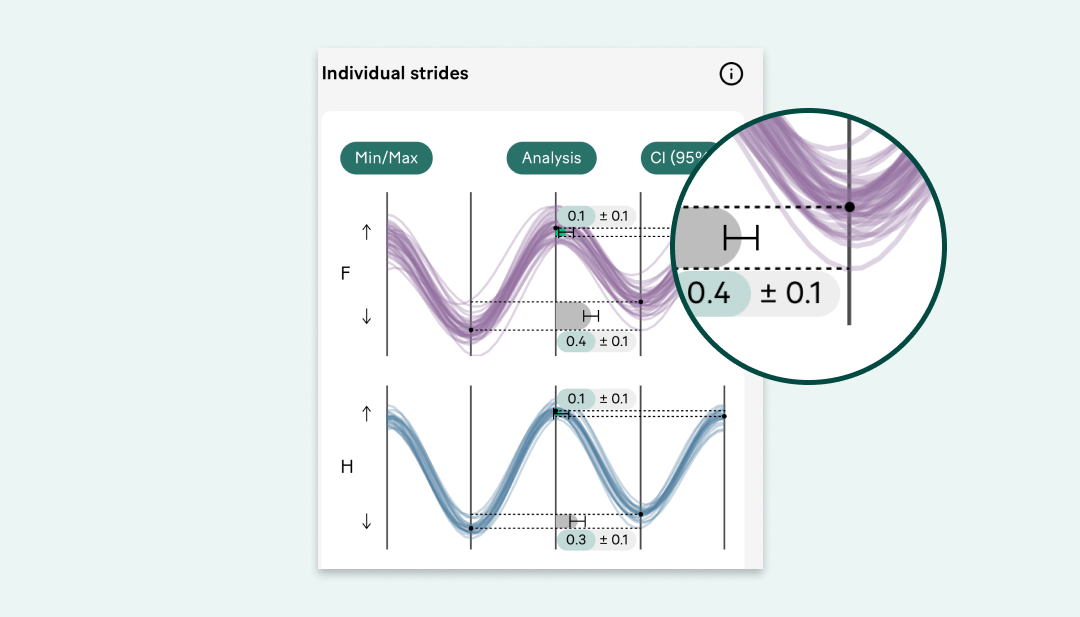
Because we analyse more than just one stride when we “sleip” a horse, a compact way to present the results is by taking the mean of the impact and push-off values.
From a strictly biological perspective, it is important to note that the calculated mean values represent a stride the horse, most likely, never took. The mean is still relevant, as long as you are careful when interpreting its meaning. To help with this interpretation, we need a measure of the stride-to-stride variation of our variables.
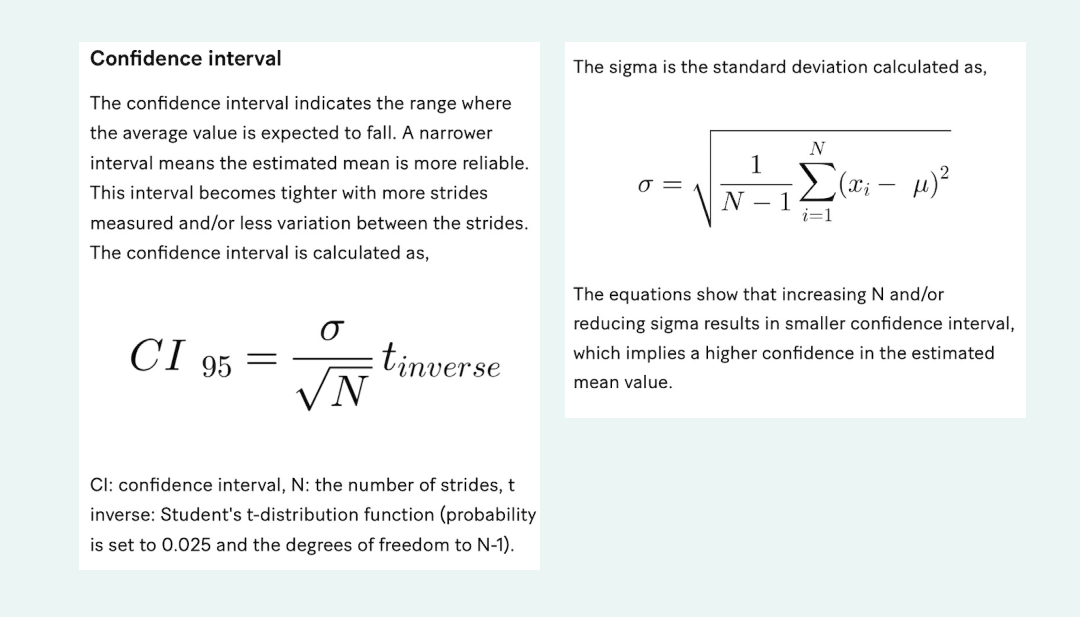
The confidence interval is a more robust approach to help our users gauge how reliable the mean value they get from the analysis is.
The CI is influenced by two things:
Traditionally within the field of equine quantitative lameness assessment, the standard deviation has been used as a reference for when a mean of an asymmetry variable can be deemed biologically relevant or not. The rule of thumb has been that if the standard deviation is larger than the absolute value of the mean, the mean value might not be biologically relevant.
When there are few samples (in our case, strides), the estimation of the mean and standard deviation becomes uncertain. Conversely, when many samples are available, we can be more certain about our statistical estimations.
This is why the confidence interval is a better choice of metric. The way it is calculated it penalises our estimation certainty when we have few samples and increases the certainty when more samples are available.
In practice, this means that if we make a recording with few strides selected for analysis and a relatively low standard deviation, we will still be uncertain about the mean value calculation because it was based on a small sample size. Conversely, if we record a lot of strides, we can be confident in our mean value calculation, even if we have a high standard deviation.
For an accurate Sleip analysis, it is important to capture enough strides for analysis. By presenting the confidence interval for each analysis, we emphasise the importance of the number of strides as a measure of the reliability of the mean value.
The confidence interval gives a more comprehensive picture of the reliability of the analyses, which is why we will also update historical analyses, as these are often used as a baseline or for comparison purposes. However, historical analyses will be updated over a period of time. Initially, the analyses from February 2023 onward will be updated, followed by those going back to February 2022 and earlier.
The button text on the individual strides graph in the app will indicate whether the standard deviation or the confidence interval is displayed for the recording. Please note that you will have to update to the latest version of the application to get confidence intervals for your data.

Sleip will continue its sponsorship of the EGAS Live Course 2026 — marking our 4 year supporting advanced post-graduate education in quantitative gait analysis for equine veterinarians.

SLU, Sleip, and a number of private equine clinics have collaborated on a study showing how anatomical size-scaling helps align objective gait data with visual lameness assessments
This summer we conducted a survey about equine lameness for more than 100 equine veterinarians from the ISELP community.